Introduction:
For this weeks lab, the Geography 336 class at UW-Eau Claire built off of the project conducted the previous week. In groups of two the class was asked to go out on campus and collect five points of elevation per person (ten per group) in a specific area of interest (AOI). These points would then be downloaded into ArcMap to create a final topographic profile of the AOI.
Study Area:
The AOI for this study was located on lower campus over the slopes of the Little Niagara, outside of Philips Hall. The Little Niagara is a natural creek that runs through the middle of lower campus. Figure 11.1 is a map depicting lower campus and then the AOI within it.
Methods:
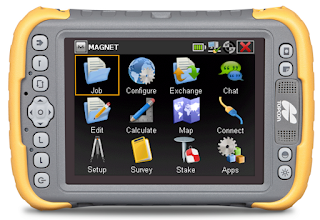
To conduct this topographic survey, the points were collected using the same Topcon TESLA Dual Frequency GPS unit (Figure 11.2) that was used in last week's data collection. However, for this week's study it was accompanied by a tripod station and stadia or leveling rod.
To collect elevation data (relative position, distance, and azimuthal), the tripod station was connected to the TESLA unit through Bluetooth. Although, everything was previously set up for the class to use, the first step in collecting the data would have been to set "north" and a background site that could be used for referencing. Then, making sure that the tripod station stayed immobile the stadia rod, which was manually held by a student, was walked to a desired location within the pre-established reference background. Once the rod was in its desired location, the front of the rod, or prism, was leveled to the landscape and faced towards the station. After the station was lined up with the center of the prism, a laser shot into and rebounded from the stadia rod back to the station which was then saved on the TESLA unit. Using this technology provides elevation data that is within millimeters of accuracy.
Once data points were collected, the final data table was downloaded as a textfile for the class to map. Figure 11.3 is what the data collected looked like when it was given to the class.
For this weeks lab, the Geography 336 class at UW-Eau Claire built off of the project conducted the previous week. In groups of two the class was asked to go out on campus and collect five points of elevation per person (ten per group) in a specific area of interest (AOI). These points would then be downloaded into ArcMap to create a final topographic profile of the AOI.
Study Area:
The AOI for this study was located on lower campus over the slopes of the Little Niagara, outside of Philips Hall. The Little Niagara is a natural creek that runs through the middle of lower campus. Figure 11.1 is a map depicting lower campus and then the AOI within it.
 |
| Figure 11.1: Outline of lower campus with an emphasis on the selected AOI. |
 |
| Figure 11.2: http://www.topconsolutions.com/site/cartpics/large/6713/Tesla.jpg |
To collect elevation data (relative position, distance, and azimuthal), the tripod station was connected to the TESLA unit through Bluetooth. Although, everything was previously set up for the class to use, the first step in collecting the data would have been to set "north" and a background site that could be used for referencing. Then, making sure that the tripod station stayed immobile the stadia rod, which was manually held by a student, was walked to a desired location within the pre-established reference background. Once the rod was in its desired location, the front of the rod, or prism, was leveled to the landscape and faced towards the station. After the station was lined up with the center of the prism, a laser shot into and rebounded from the stadia rod back to the station which was then saved on the TESLA unit. Using this technology provides elevation data that is within millimeters of accuracy.
Once data points were collected, the final data table was downloaded as a textfile for the class to map. Figure 11.3 is what the data collected looked like when it was given to the class.
 |
| Figure 11.3: Corresponding data for the elevation points collected. |
To prepare the data for importing into ArcMap, the data headers had to be normalized so the attributing data could correctly be downloaded and analysed. Once this was done, x (easting), y (northing), and z (Ht) data was added onto ArcMap.
Results and Discussion:
After the data was projected into a desired coordinate system and a basemap was added, figure 11.4 became the result. As can be seen, some of the points appear to be located directly in the Little Niagara. This is because the data collected is actually more accurate than the basemap, making the data look slightly off.
 |
| Figure 11.4: Location of elevation data points collected from survey. |
From here, a triangulated irregular network (TIN) was created from the the "z" (Ht) field and overlayed on top of the base map for the purpose of referencing. Figure 11.5 is the final map showing the topography from that data collected. As it can be seen from the different elevation categories, there is about a two meter difference from the banks of the Little Niagara to the edges of the surveyed area. Furthermore, as distance is gained from the banks, the steepness decreases.
 |
| Figure 11.5: Final elevation map showing topographic profile of surveyed terrain. |
Conclusion:
By using the correct surveying systems, collecting data such as elevation, can be simple yet very accurate and effective. In conducting these surveys, a better understanding of the desired topography can be deduced and evaluated.
Comments
Post a Comment